📊 Interactive Graphs
Explore the roots reggae universe through four interactive visualizations. Each graph reveals a different facet of 15 years of Jamaican music history.
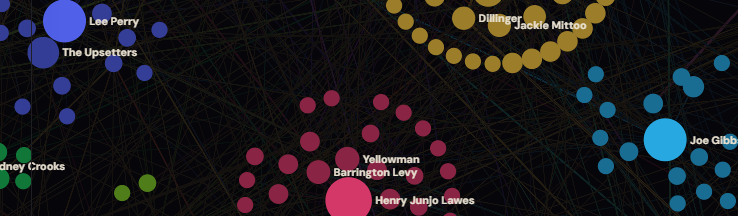
The Galaxy is a large-scale constellation map of the entire Roots Archives database. It organizes hundreds of artists, producers, labels, studios and backing bands into gravitational clusters, each hub pulling its collaborators into orbit around it.
Switch between five distinct views — Producers, Backing Bands, Labels, and Studios, to reveal different perspectives on the same musical universe.
A timeline slider (1969–1986) lets you animate the graph through time: nodes are born, glow, age and fade, showing how the scene evolved year by year. Hit Play and watch the Jamaican music industry bloom.
Built with Sigma.js and Graphology. Best on desktop with a mouse wheel for zooming.
5 switchable views
Timeline 1969–1986 with playback
Hover / click to explore connections
Search across all nodes
LOD system adapts to zoom level
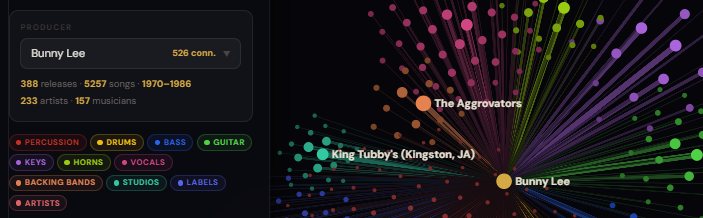
Select any producer from the dropdown and see their entire "possee" — every artist, musician, backing band, studio, label and engineer they ever worked with — arranged in distinct role-based zones radiating from the center.
Each zone represents a musical role: Drums, Bass, Guitar, Keys, Horns, Vocals, Engineers, Arrangers, Studios, Labels, and more. Nodes are sized by the number of shared releases, and colored by zone.
Open the Layout Tuner (⚙) to adjust 40+ parameters in real time — zone distances, densities, node sizes, edge opacity, anti-collision settings. The graph automatically adapts its layout based on the number of connections using an intelligent auto-preset system that interpolates between three calibrated tiers.
You can save and share your presets — they are stored locally in your browser's localStorage. If you find a particularly beautiful or insightful layout, export it as JSON and share it with the community via the forum!
Role-based zone layout
Custom dropdown with 100+ producers
40+ tunable parameters in the Layout Tuner
Auto-presets that adapt to graph density
Preset save / export / import (JSON)
Edge pulse animation
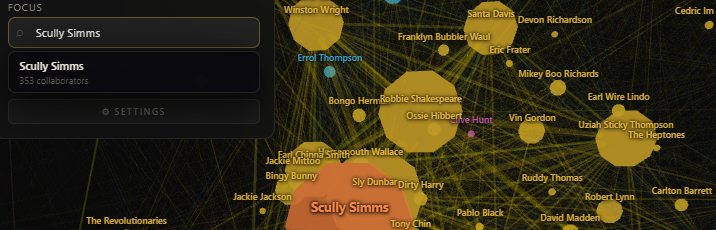
The original graph: a force-directed 3D network built with Three.js that maps the connections between artists in the Roots Archives database. Pick an artist or browse by category to see who worked with whom, how often, and in what capacity.
Nodes attract and repel each other based on the strength of their musical connections — artists who frequently collaborated are drawn closer together, forming tight clusters, while loosely related figures drift to the periphery.
Navigate by rotating, zooming and clicking on nodes to highlight their direct connections and discover unexpected links between artists, producers and labels.
3D force-directed layout
Dynamic node highlighting on click
Rotatable, zoomable canvas
Category filters (artists, producers, labels…)
The Studio Timeline maps how artists moved between recording studios along a vertical year axis (1969–1988). Each studio appears as a vertical stem whose width at any given year reflects the volume of sessions recorded there.
Color-coded trajectories trace individual artists as they migrated between studios — from Channel One to King Tubby's, Black Ark, Joe Gibbs, Harry J and more. Dots mark every studio visit, sized by the number of albums recorded.
Use the sidebar controls to adjust the year range, the number of studios and artists shown, minimum album thresholds, and all visual parameters (trajectory opacity, thickness, stem width) in real time. Click any studio in the legend to filter and highlight its artists.
Vertical year axis with zoom & pan
Up to 15 studios with color-coded stems
Artist trajectories with cubic-bezier curves
Click legend / studio to filter artists
All parameters tunable in real time
Keyboard navigation (arrows, +/-, R to reset)
Pick any artist and instantly see their entire creative circle fanned out in a radial tree. Branches radiate upward from the root artist, one per musical role (Producer, Vocals, Guitar, Bass, Drums, Keys…). Each collaborator appears as a leaf positioned at the year of their first joint release.
The further from the center, the more recent the collaboration. Hover any leaf to see the number of shared albums and the full period of collaboration. Click to highlight a branch.
Radial layout — root artist at center
One branch per role (Producer, Vocals, Guitar…)
Year encoded as radius distance
Autocomplete artist search
Zoom / pan / keyboard navigation
Hover tooltip with shared album count
💾 About saving your layouts
Most of our graphs include powerful settings panels with saveable presets. These presets are stored locally in your browser (using localStorage) — they are not synced across devices or saved on the server.
If you discover a particularly stunning or insightful layout, you can export it as JSON from the Presets panel and share it with the community on our Forum. Other users can then import your JSON to reproduce the exact same view.